|
|
En el CIMA están disponibles, dependiendo
de cada variable en particular, estos
Productos: VARIABLES A NIVELES DE PRESION (AN:analisis)
|
|
(**)DODS, Catálogo de archivos remoto; es posible navegar por sus directorios, permite inspeccionar la estructura y metadatos de los archivos almacenados. También abrir archivos a distancia (servidor OpenDAP). Ejemplo: Abrir un archivo con Grads (albedo) Obtener la URL del archivo a graficar en el DODS Buscar en http://gds.cima.fcen.uba.ar:9090/dods/ la variable a graficar Buscar en Reanalisis > Sudamerica >> Superficie >>> ALBDO >>>> info Copiar la dirección indicada en Data URL http://gds.cima.fcen.uba.ar:9090/dods/Reanalisis/Sudamerica/Superficie/ALBDO Para abrir este archivo con Grads: en lugar de usar “open” poner “sdfopen” >grads ga-> sdfopen http://gds.cima.fcen.uba.ar:9090/dods/Reanalisis/Sudamerica/Superficie/ALBDO ga-> d albdosfc
Nota: Usar Grads version 2.0.a6 o superior, para manejar archivos grib2 y opendap. Ejemplo: Abrir un archivo con Matlab v2008/2009(tmax) Obtener la URL del archivo a graficar en el DODS En matlab, al abrir el archivo, hay que agregar el nombre de la variable y las dimensiones de los arreglos que la contienen: http://gds.cima.fcen.uba.ar:9090/dods/ Buscar en Sudamerica > Superficie >> TMAX >>> info URL: http://gds.cima.fcen.uba.ar:9090/dods/Sudamerica/Superficie/TMAX Buscar: Variables.... tmax2m: Grid... tmax2m: Array of 32 bit Reals [time = 0..45290][lat = 0..160][lon = 0..110] Entonces, para abrir el archivo es: x=loaddap(' http://gds.cima.fcen.uba.ar:9090/dods/Reanalisis/Sudamerica/Superficie/TMAX?tmax2m[0:0][0:160][0:110] ')
Hay que poner el URL, ?, el nombre de la variable, Y los límites de las dimensiones a recuperar en el orden indicado (tpo, lat,lon). NOTA, a partir de la versión 12a, Matlab trae incluido el toolbox para abrir archivos via OpenDAP, para versiones anteriores hay que bajar loaddap:
Matlab
loaddap
Tool 3.7.2, 31 May 2012 Matlab
loaddap
Tool 3.7.2, 31 May 2012 Seguir las instrucciones, Y leer el readme del loaddap, (explica como configurar matlab para que funcione):
-------------
Be sure to add loaddap's directory to your matlabpath! For example, you could add
addpath /usr/local/bin
to startup.m. The order of the paths' in the matlabpath variable is important!
However you add the paths, /usr/local/bin should appear before /usr/local/share/loaddap.
If the order is reversed you will get a error in matlab about mismatched parentheses.
Here's what matlabpath looks like when it's set correctly:
<code>
>> matlabpath
MATLABPATH
/usr/local/bin
/Applications/MATLAB71/toolbox/matlab/general
..
.
</code>
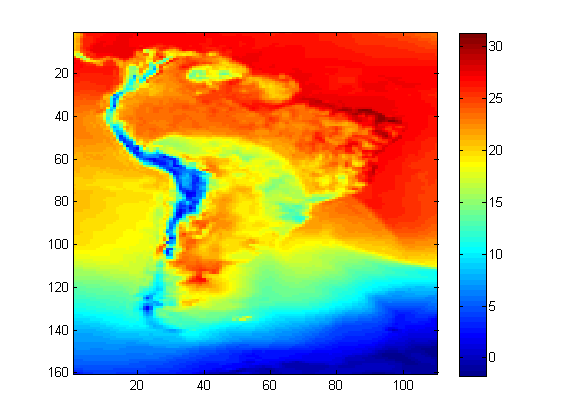
Ejemplo: Abrir un archivo con Matlab v2012a (tmax) (gentileza Alfredo Rolla) Buscar el URL del archivo en el GDS (Idem anterior) Para abrir el archivo: =========================================== %Abrir un archivo en gds y ver dimensiones , %recortar una variable y graficar un tiempo de tmax f=' http://gds.cima.fcen.uba.ar:9090/dods/Reanalisis/Sudamerica/Superficie/TMAX '; ncid=netcdf.open(f); [name,xtype,dimids,natts]=netcdf.inqVar(ncid,0); name [name,xtype,dimids,natts]=netcdf.inqVar(ncid,1); name [name,xtype,dimids,natts]=netcdf.inqVar(ncid,2); name [name,xtype,dimids,natts]=netcdf.inqVar(ncid,3); name %format longG; Times=netcdf.getVar(ncid,0); Lats=netcdf.getVar(ncid,1); Lons=netcdf.getVar(ncid,2); %recortamos el archivo para ver un tiempo solamente tmax=netcdf.getVar(ncid,3,[1,1,1],[110,160,1]); tmax=squeeze(tmax); %imagesc(flipdim(tmax,x));figure(gcf); imagesc(flipdim(tmax',1)-273.15);figure(gcf); colorbar(); |